Deep Learning Tutorial - Convolutional Neural Networks
CNN Exercise
The CNN exercise is involved and fairly tricky, but for the most part it’s outlined well and you can figure out what you need to do pretty clearly from the instructions if you take your time.
To really understand what’s going on, though, I think it can use some further explanation.
ZCA Whitening
The provided code uses the matrix ‘ZCAWhite’ to apply ZCA whitening to the image patches. This confused me a bit, because in the ZCA whitening exercise earlier on in the tutorial, we applied ZCA whitening as a series of steps. First we used PCA to project the image patch onto the eigenvectors. Then we applied whitening. Finally, we multiply the whitened data with the eigenvectors once more to arrive at the ZCA whitened data.
In the CNN exercise, all of these operations have been bundled into a single matrix, ‘ZCAWhite’, which can be multiplied with an image path to arrive at the ZCA whitened patch. You can go back and look at ‘linearDecoderExercise.m’ to learn how the ‘ZCAWhite’ matrix was formed.
Calculating Features with Convolution
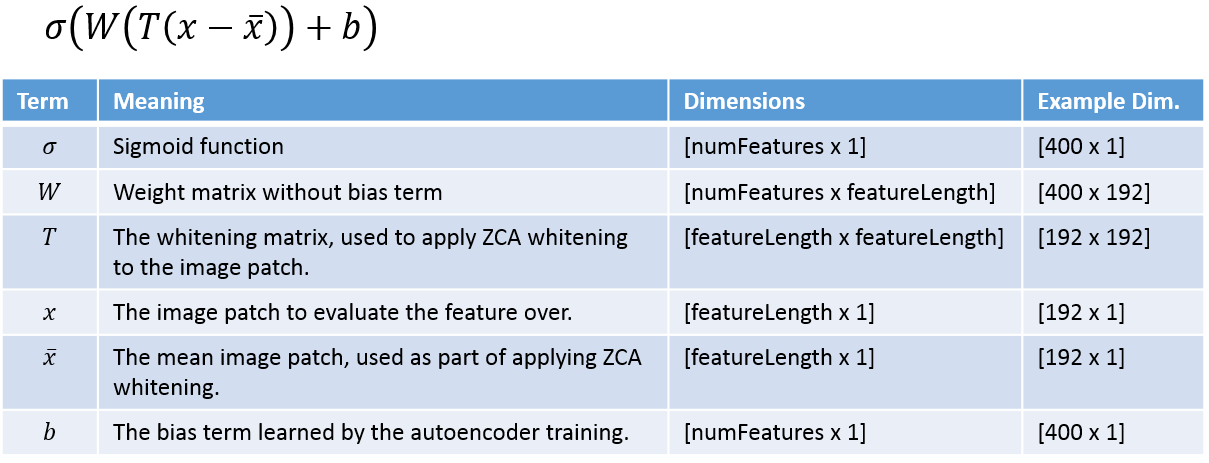
The following equation is provided in the exercise description for calculating the features for an image patch. The inner term, (T(x - x_bar)) is the ZCA whitening step. The remainder is the evaluation of all 400 features over the image patch. This equation helps you understand the operation we’re performing; however, it’s applied to only a single image patch, and the image patch is represented as a column vector rather than a 2D array.
They expand the terms in the above equation to arrive at the following:

The key insight from this re-ordered equation is that the second and third terms are independent of the image patch–you only need to calculate these once, whereas the the WTx term must be calculated separately for each image patch.
Again, the above equations are written to be applied to a single image patch at a time. We are going to take a different approach that utilizes the concept of a matrix convolution to apply the filter to a larger image area. I suspect that the reason for using matrix convolutions is that it is more intuitive to visualize the operation this way, and because optimized routines and hardware exist for performing matrix convolutions.
If you are familiar with the concept of image filters, then you probably already have a good handle on what a matrix convolution is. If not, the tutorial provides a nice description, or you may also find my post on image filters helpful.
The challenge for this exercise is to take the above single-patch, vector-based equation, and turn it into a convolution operation which is applied to a larger two-dimensional image region.
The inputs to a convolution operation are a small 2D ‘kernel’ matrix (in this case the weights for a feature), and a larger 2D image. Each feature has a different set of weights for each color channel, so we will be performing the convolution on each color channel separately.
In the above equation, the terms have been re-arranged such that we will actually be applying the whitening matrix to the weight matrix W rather than to the image patches directly. You can do this once, and then use the “whitened features” as the kernel matrix.
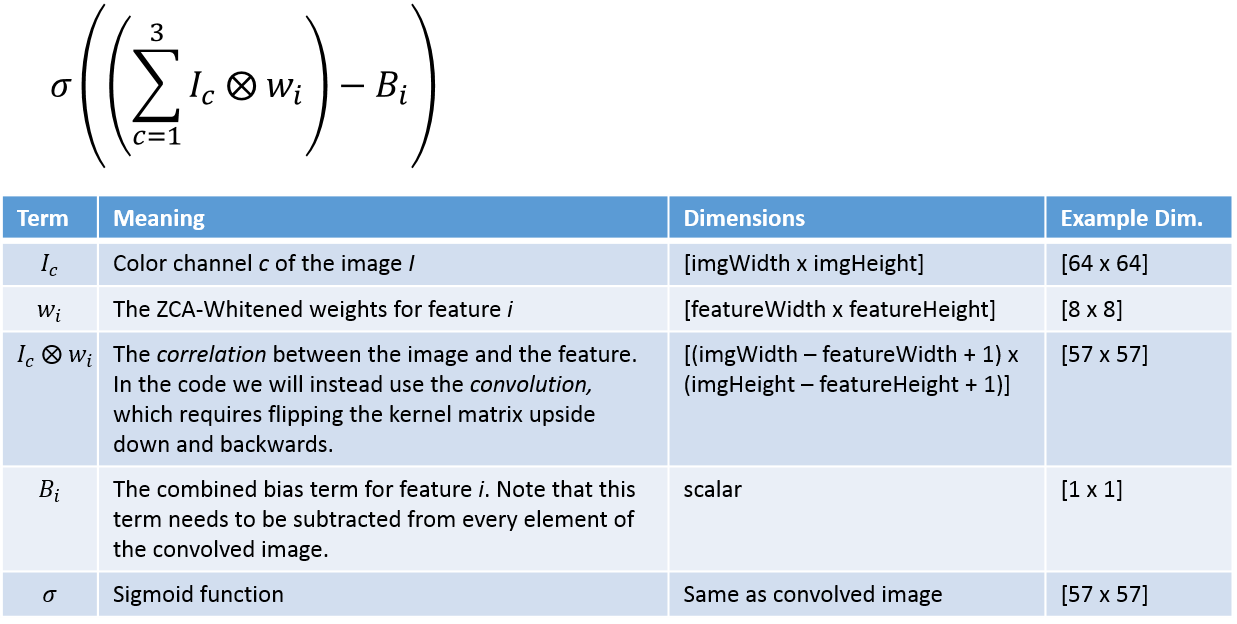
Below is the equation and explanation of the convolution operation we’ll be performing.
The feature vectors are stored in a matrix and need to be reshaped back into 8 x 8 element kernels. You can do this using the ‘reshape’ command:
reshape(feature, 8, 8, 3);
where ‘feature’ is the 192-value feature vector.
The combined bias term is given by the following equation.
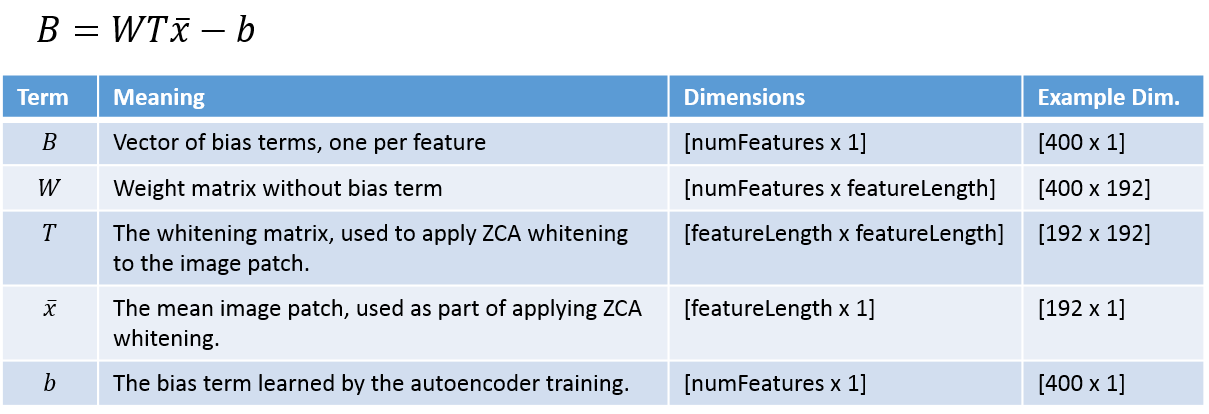
Note that you need to be careful of the signs of the terms. You can either add (b - WTx) or you can_ subtract (WTx - b)_ as I have here.
Note that the bias term amounts to a single value per feature which gets added to every pixel of the convolved image.
The above equation allows you to pre-calculate all of the bias values.
I think it’s also helpful to keep in mind that the output of a single feature calculated over an 8 x 8 pixel image patch (with three color channels) is just a single value. This single value represents the strength of the presence of that feature in the image patch.
Pooling
In this CNN exercise, we start with 64 x 64 pixel color images. After convolving with the feature vectors, the convolved images will be 57 x 57 pixels. We will divide these 57 x 57 convolved images into a grid of 9 pooling regions (19 x 19 pixels each). In each pooling region, we will compute the average value of the feature.
In the convolution step of the exercise, the provided code makes use of the ‘squeeze’ function. This function is necessary when working with high dimensional matrices. When you have a four-dimensional matrix, for example, and select a subset of the values from one or two of the dimensions, the resulting matrix still has four dimensions. The squeeze function will strip off these extra dimensions for you.
For example, you’ll want to select a specific convolved image from the ‘convolvedFeatures’ matrix using something like the following:
convolvedFeatures(featureNum, imageNum, :, : )
What you may not be expecting, though, is that this selection will actually return a matrix with the dimensions (1, 1, 57, 57). Squeeze will strip off those dimensions where the size is 1, leaving you with just the 57 x 57 matrix that you want:
convolvedImage = squeeze(convolvedFeatures(featureNum, imageNum, :, : ));
Traing and Testing on the STL-10 Dataset
You can read more about the STL-10 dataset and see some example images here:
http://web.stanford.edu/~acoates/stl10/
The CNN will compute 9 values for each of the 400 features, giving a total feature vector length of 3,600 values. There are 3,200 training examples which we will use to train a Softmax classifier.
The final accuracy of 80% seems very impressive to me, given the highly unstructured nature of the images (compared to, for example, the hand-written digits).