Deep Learning Tutorial - Sparse Autoencoder
This post contains my notes on the Autoencoder section of Stanford’s deep learning tutorial / CS294A. It also contains my notes on the sparse autoencoder exercise, which was easily the most challenging piece of Matlab code I’ve ever written!!!
Autoencoders And Sparsity
-
Autoencoder - By training a neural network to produce an output that’s identical to the input, but having fewer nodes in the hidden layer than in the input, you’ve built a tool for compressing the data.
-
Going from the input to the hidden layer is the compression step. You take, e.g., a 100 element vector and compress it to a 50 element vector.
-
Going from the hidden layer to the output layer is the decompression step. You take the 50 element vector and compute a 100 element vector that’s ideally close to the original input.
-
-
Sparse activation - Alternatively, you could allow for a large number of hidden units, but require that, for a given input, most of the hidden neurons only produce a very small activation.
-
For a given hidden node, it’s average activation value (over all the training samples) should be a small value close to zero, e.g., 0.5
-
A term is added to the cost function which increases the cost if the above is not true.
-
Visualizing A Trained Autoencoder
In this section, we’re trying to gain some insight into what the trained autoencoder neurons are looking for. For a given neuron, we want to figure out what input vector will cause the neuron to produce it’s largest response.
That’s tricky, because really the answer is an input vector whose components are all set to either positive or negative infinity depending on the sign of the corresponding weight.
So we have to put a constraint on the problem. Specifically, we’re constraining the magnitude of the input, and stating that the squared magnitude of the input vector should be no larger than 1.
Given this constraint, the input vector which will produce the largest response is one which is pointing in the same direction as the weight vector.
The below examples show the dot product between two vectors. The magnitude of the dot product is largest when the vectors are parallel.


Ok, that’s great. But in the real world, the magnitude of the input vector is not constrained. The reality is that a vector with larger magnitude components (corresponding, for example, to a higher contrast image) could produce a stronger response than a vector with lower magnitude components (a lower contrast image), even if the smaller vector is more in alignment with the weight vector.
Given this fact, I don’t have a strong answer for why the visualization is still meaningful. I suspect that the “whitening” preprocessing step may have something to do with this, since it may ensure that the inputs tend to all be high contrast.
Sparse Autoencoder Exercise
For the exercise, you’ll be implementing a sparse autoencoder. No simple task!
The work essentially boils down to taking the equations provided in the lecture notes and expressing them in Matlab code.
I won’t be providing my source code for the exercise since that would ruin the learning process. However, I will offer my notes and interpretations of the functions, and provide some tips on how to convert these into vectorized Matlab expressions (Note that the next exercise in the tutorial is to vectorize your sparse autoencoder cost function, so you may as well do that now).
If you are using Octave, like myself, there are a few tweaks you’ll need to make. See my ‘notes for Octave users’ at the end of the post.
Step 1: Compute Cost
The first step is to compute the current cost given the current values of the weights.
Step 1.1: Feedforward Evaluation
In order to calculate the network’s error over the training set, the first step is to actually evaluate the network for every single training example and store the resulting neuron activation values. We’ll need these activation values both for calculating the cost and for calculating the gradients later on.
Step 1.2: Mean Squared Error (MSE) Cost
Once you have the network’s outputs for all of the training examples, we can use the first part of Equation (8) in the lecture notes to compute the average squared difference between the network’s output and the training output (the “Mean Squared Error”).
Step 1.3: Regularization Cost
Next, we need to add in the regularization cost term (also a part of Equation (8)).

This term is a complex way of describing a fairly simple step. You just need to square every single weight value in both weight matrices (W1 and W2), and sum all of them up. Finally, multiply the result by lambda over 2.
Note that in the notation used in this course, the bias terms are stored in a separate variable _b. _This means they’re not included in the regularization term, which is good, because they should not be.
Step 1.4: Sparsity Cost
Next, we need add in the sparsity constraint.
First we’ll need to calculate the average activation value for each hidden neuron.

If a2 is a matrix containing the hidden neuron activations with one row per hidden neuron and one column per training example, then you can just sum along the rows of a2 and divide by m.
The result is pHat, a column vector with one row per hidden neuron.
Once you have pHat, you can calculate the sparsity cost term.

To vectorize this equation:
-
Use the pHat column vector from the previous step in place of pHat_j
-
Replicate p into a column vector.
-
Use element-wise operators. That is, use “.*” for multiplication and “./” for division.
This will give you a column vector containing the sparisty cost for each hidden neuron; take the sum of this vector as the final sparsity cost.
The final cost value is just the sum of the base MSE, the regularization term, and the sparsity term.
Step 2: Computing Gradients
This part is quite the challenge, but remarkably, it boils down to only ten lines of code.
Note: I’ve described here how to calculate the gradients for the weight matrix W, but not for the bias terms b. The bias term gradients are simpler, so I’m leaving them to you.
I think it helps to look first at where we’re headed. The final goal is given by the update rule on page 10 of the lecture notes.
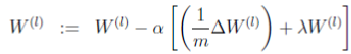
This is the update rule for gradient descent. However, we’re not strictly using gradient descent–we’re using a fancier optimization routine called “L-BFGS” which just needs the current cost, plus the average gradients given by the following term (which is “W1grad” in the code):
[Equation 2.1]
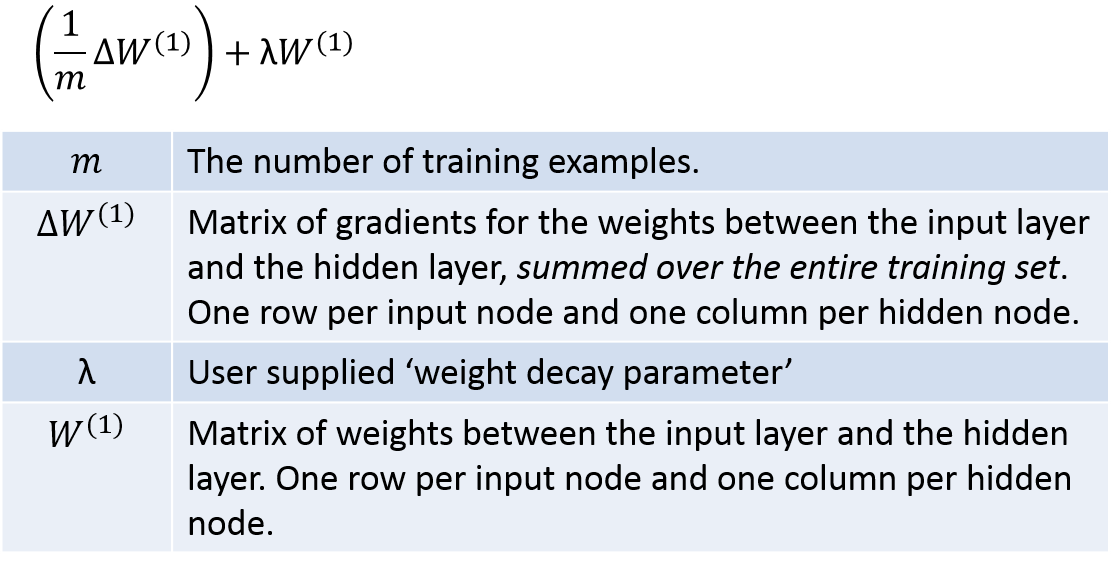
We need to compute this for both W1grad and W2grad.
The key term here which we have to work hard to calculate is the matrix of weight gradients (the second term in the table).
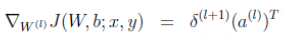
To understand how the weight gradients are calculated, it’s most clear when you look at this equation (from page 8 of the lecture notes) which gives you the gradient value for a single weight value relative to a single training example. This equation needs to be evaluated for every combination of j and i, leading to a matrix with same dimensions as the weight matrix. Then it needs to be evaluated for every training example, and the resulting matrices are summed.

In the lecture notes, step 4 at the top of page 9 shows you how to vectorize this over all of the weights for a single training example:
Finally, step 2 at the bottom of page 9 shows you how to sum these up for every training example.
Instead of looping over the training examples, though, we can express this as a matrix operation:
[Equation 2.2]
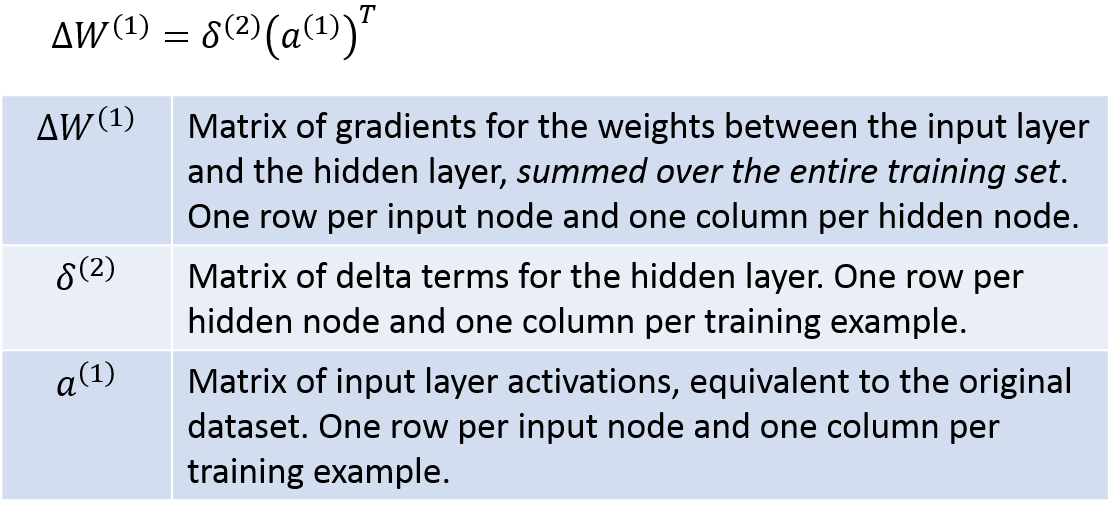
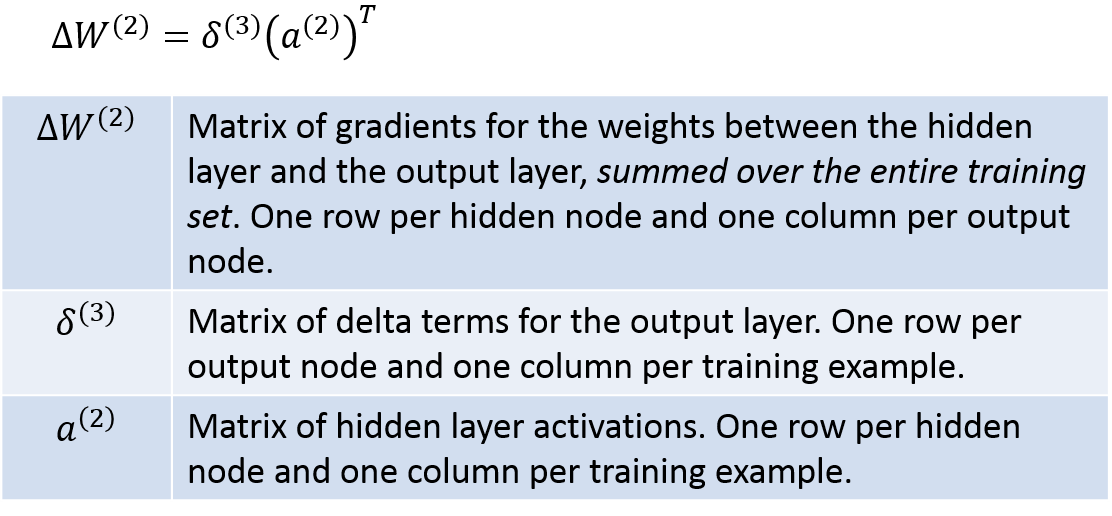
So we can see that there are ultimately four matrices that we’ll need: a1, a2, delta2, and delta3. Once we have these four, we’re ready to calculate the final gradient matrices W1grad and W2grad. We already have a1 and a2 from step 1.1, so we’re halfway there, ha!
Delta3 can be calculated with the following. I’ve taken the equations from the lecture notes and modified them slightly to be matrix operations, so they translate pretty directly into Matlab code; you’re welcome :).

Next, the below equations show you how to calculate delta2. Again I’ve modified the equations into a vectorized form. Here the notation gets a little wacky, and I’ve even resorted to making up my own symbols! Hopefully the table below will explain the operations clearly, though. Just be careful in looking at whether each operation is a regular matrix product, an element-wise product, etc.
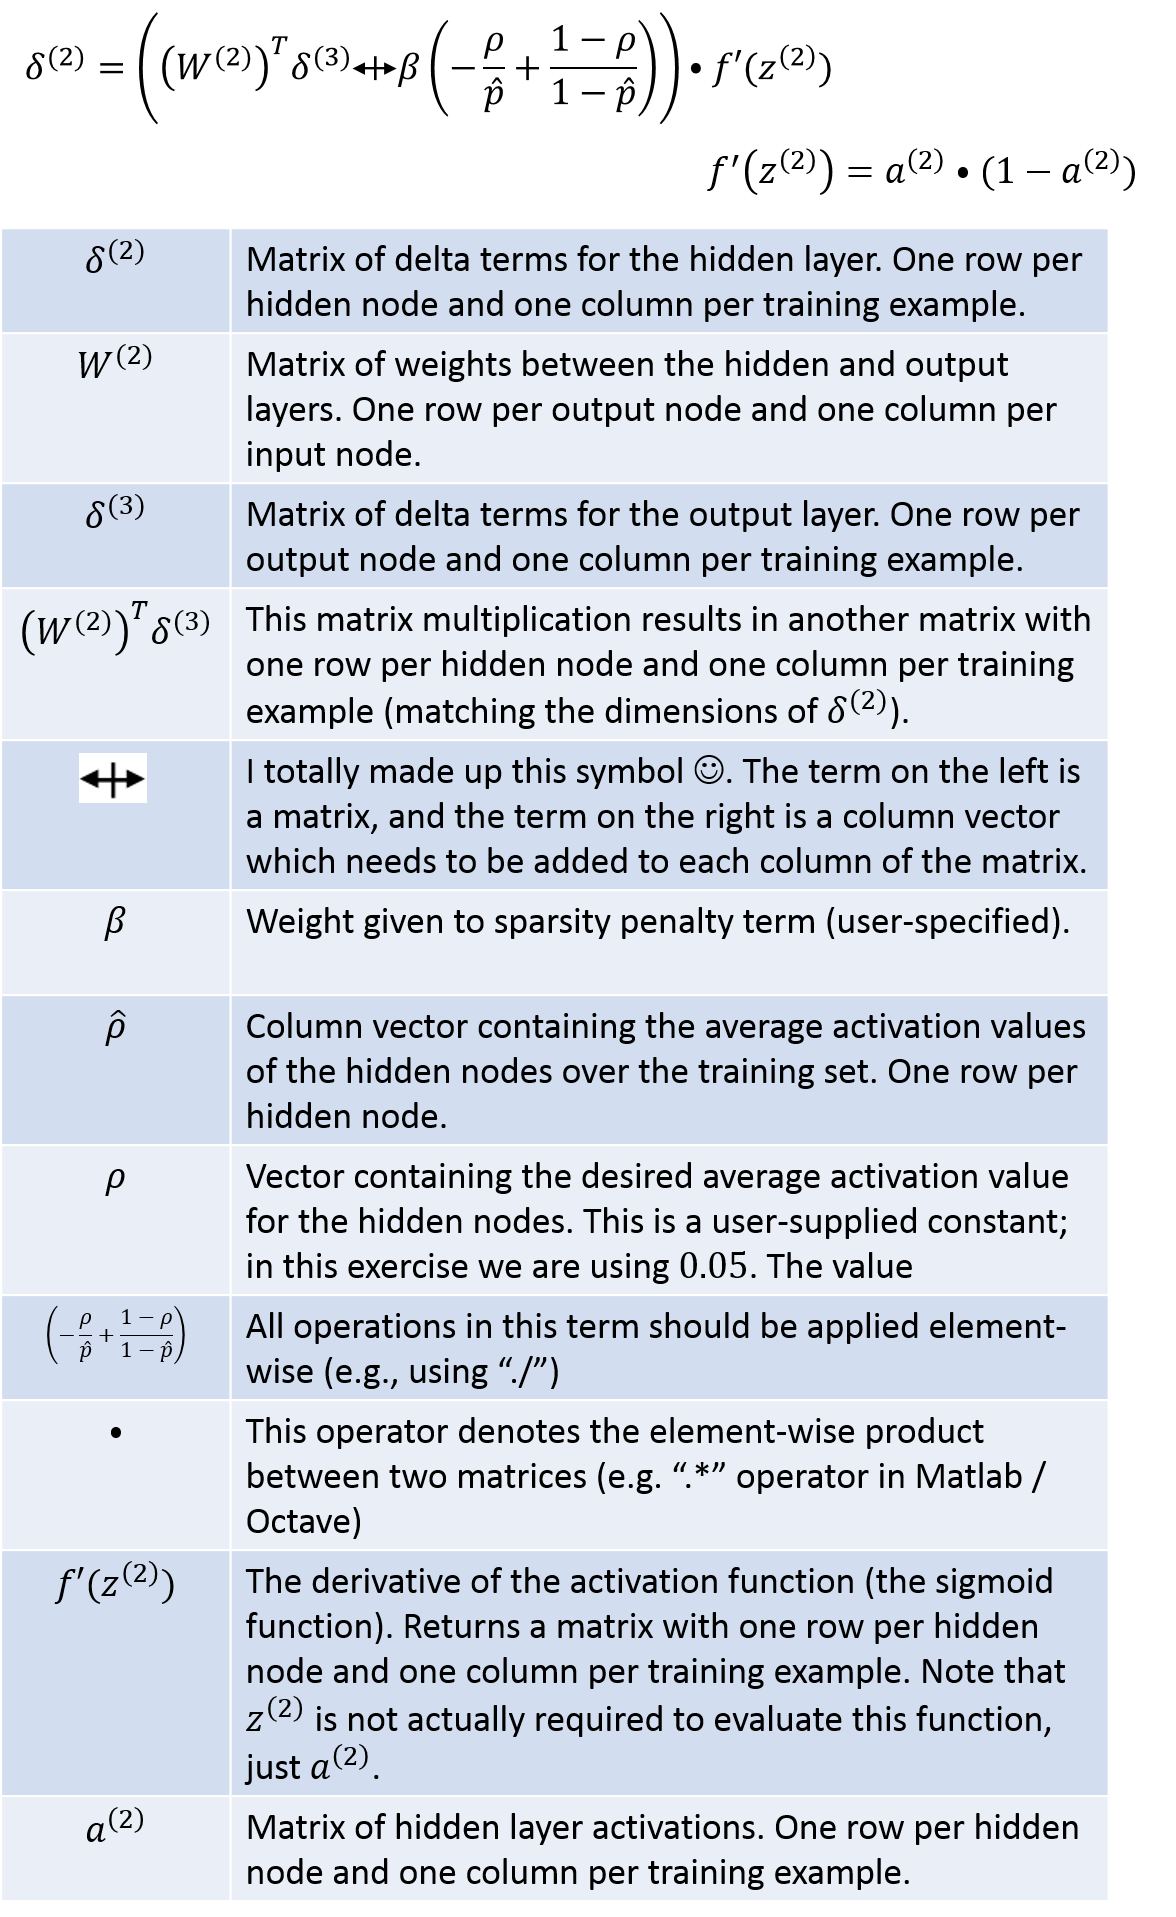
Now that you have delta3 and delta2, you can evaluate [Equation 2.2], then plug the result into [Equation 2.1] to get your final matrices W1grad and W2grad. Whew!
Use the lecture notes to figure out how to calculate b1grad and b2grad. It’s not too tricky, since they’re also based on the delta2 and delta3 matrices that we’ve already computed.
Good luck!
Vectorization Exercise
The next segment covers vectorization of your Matlab / Octave code. You may have already done this during the sparse autoencoder exercise, as I did.
In that case, you’re just going to apply your sparse autoencoder to a dataset containing hand-written digits (called the MNIST dataset) instead of patches from natural images.
They don’t provide a code zip file for this exercise, you just modify your code from the sparse autoencoder exercise.
One important note, I think, is that the gradient checking part runs extremely slow on this MNIST dataset, so you’ll probably want to disable that section of the ‘train.m’ file.
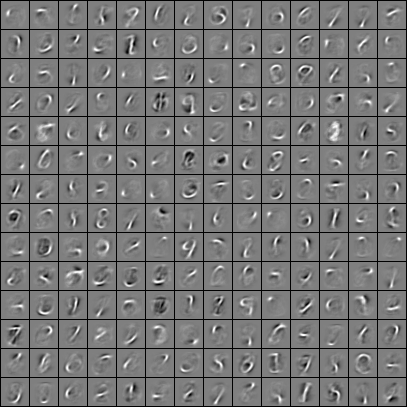
Here is my visualization of the final trained weights. The weights appeared to be mapped to pixel values such that a negative weight value is black, a weight value close to zero is grey, and a positive weight value is white.
Notes For Octave Users
I implemented these exercises in Octave rather than Matlab, and so I had to make a few changes.
-
In ‘display_network.m’, replace the line: “h=imagesc(array,’EraseMode’,’none’,[-1 1]);” with “h=imagesc(array, [-1 1]);” The Octave version of ‘imagesc’ doesn’t support this ‘EraseMode’ parameter.
-
The ‘print’ command didn’t work for me. Instead, at the end of ‘display_network.m’, I added the following line: “imwrite((array + 1) ./ 2, “visualization.png”);” This will save the visualization to ‘visualization.png’.
-
Octave doesn’t support ‘Mex’ code, so when setting the options for ‘minFunc’ in train.m, add the following line: “options.useMex = false;”
-
Perhaps because it’s not using the Mex code, minFunc would run out of memory before completing. This was an issue for me with the MNIST dataset (from the Vectorization exercise), but not for the natural images. To work around this, instead of running minFunc for 400 iterations, I ran it for 50 iterations and did this 8 times. After each run, I used the learned weights as the initial weights for the next run (i.e., set ‘theta = opttheta’).